Problem
Around 2015, Harim Jung, a young Korean nuclear engineer, moved to the United Arab Emirates for an internship and her first engineering job. In her spare time she taught herself to turn data into pictures, first with the programming language R, then with the visualization tool Tableau.
By 2021 she could name the problem. Talking about the flood of reports that agencies publish, she told the data storytelling platform Kontinentalist: “How many reports and research come out a day? It’s like hundreds, but no one cares.”
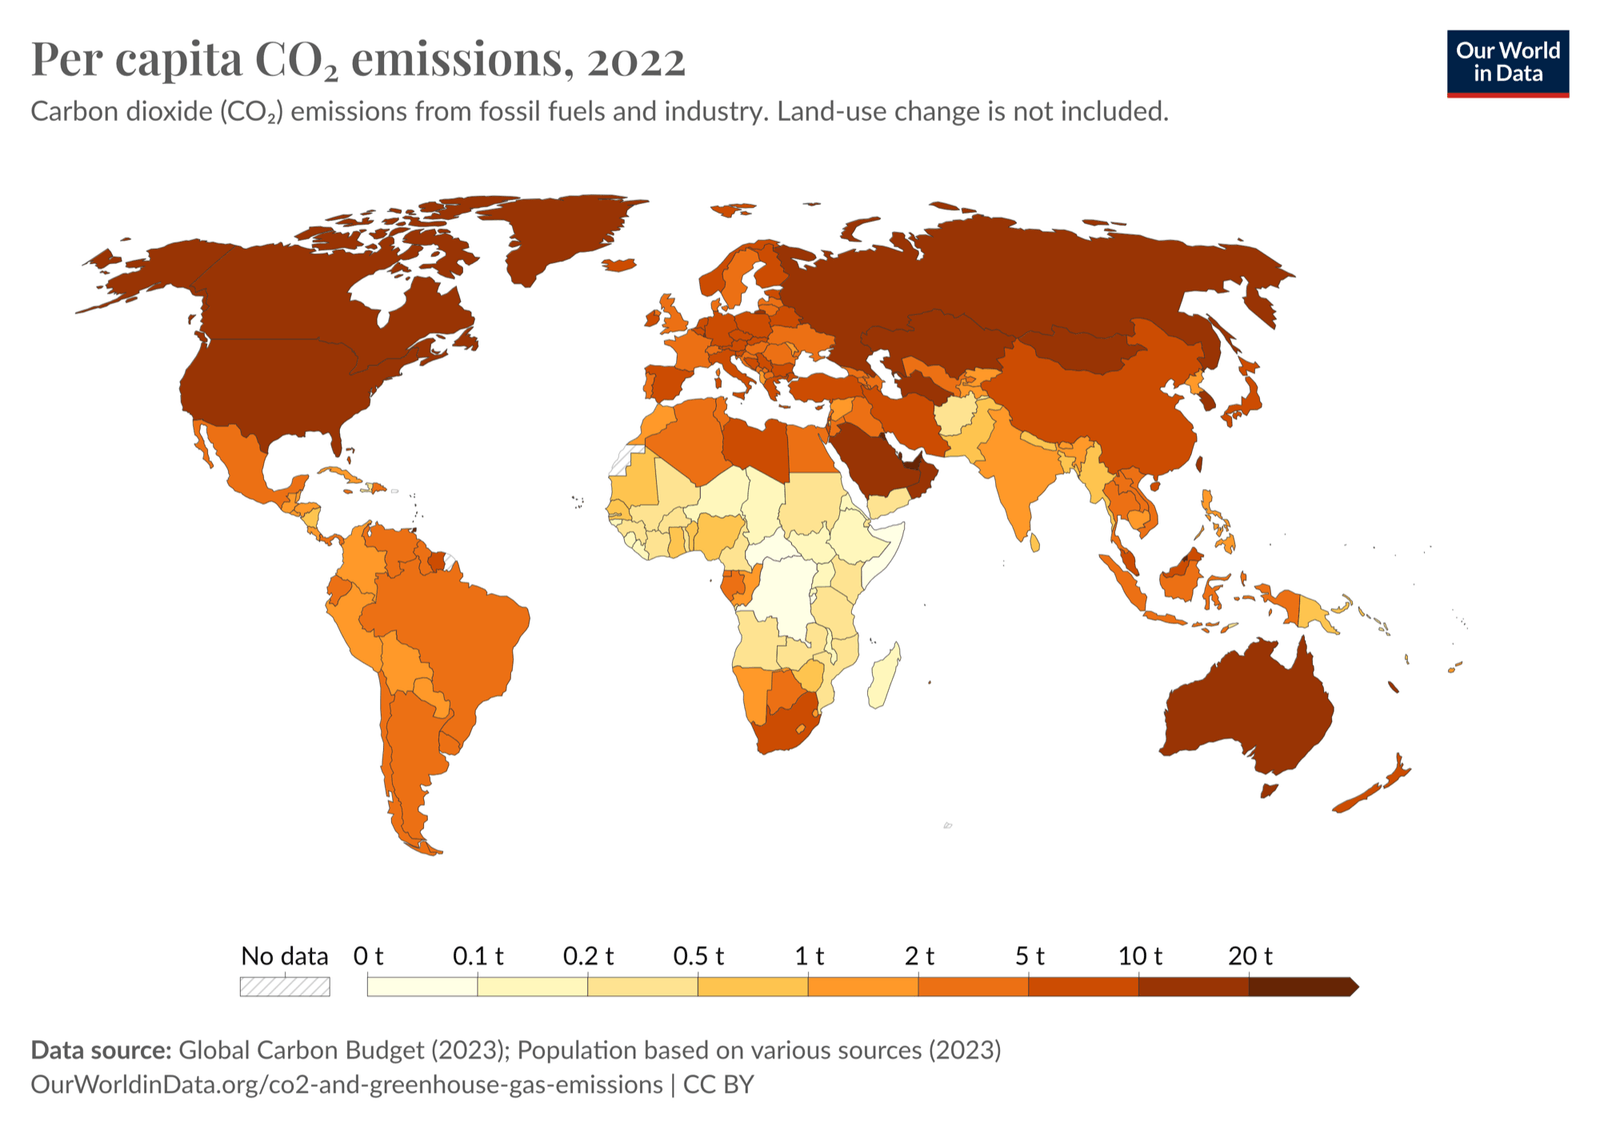
Climate data has the same problem. Most of it is public, from the World Bank, energy think tanks and research groups, but it sits in different places, formats and units. Making sense of one country’s record takes research skills and time, and teachers, students and local journalists rarely have either.
AI solution
Visual Climate (visualclimate.org) has three parts: a report card that gives each country one letter grade from A+ to F, a deeper country page with charts on emissions, energy, economy and resilience, and six types of data poster that anyone can download free, with no login.
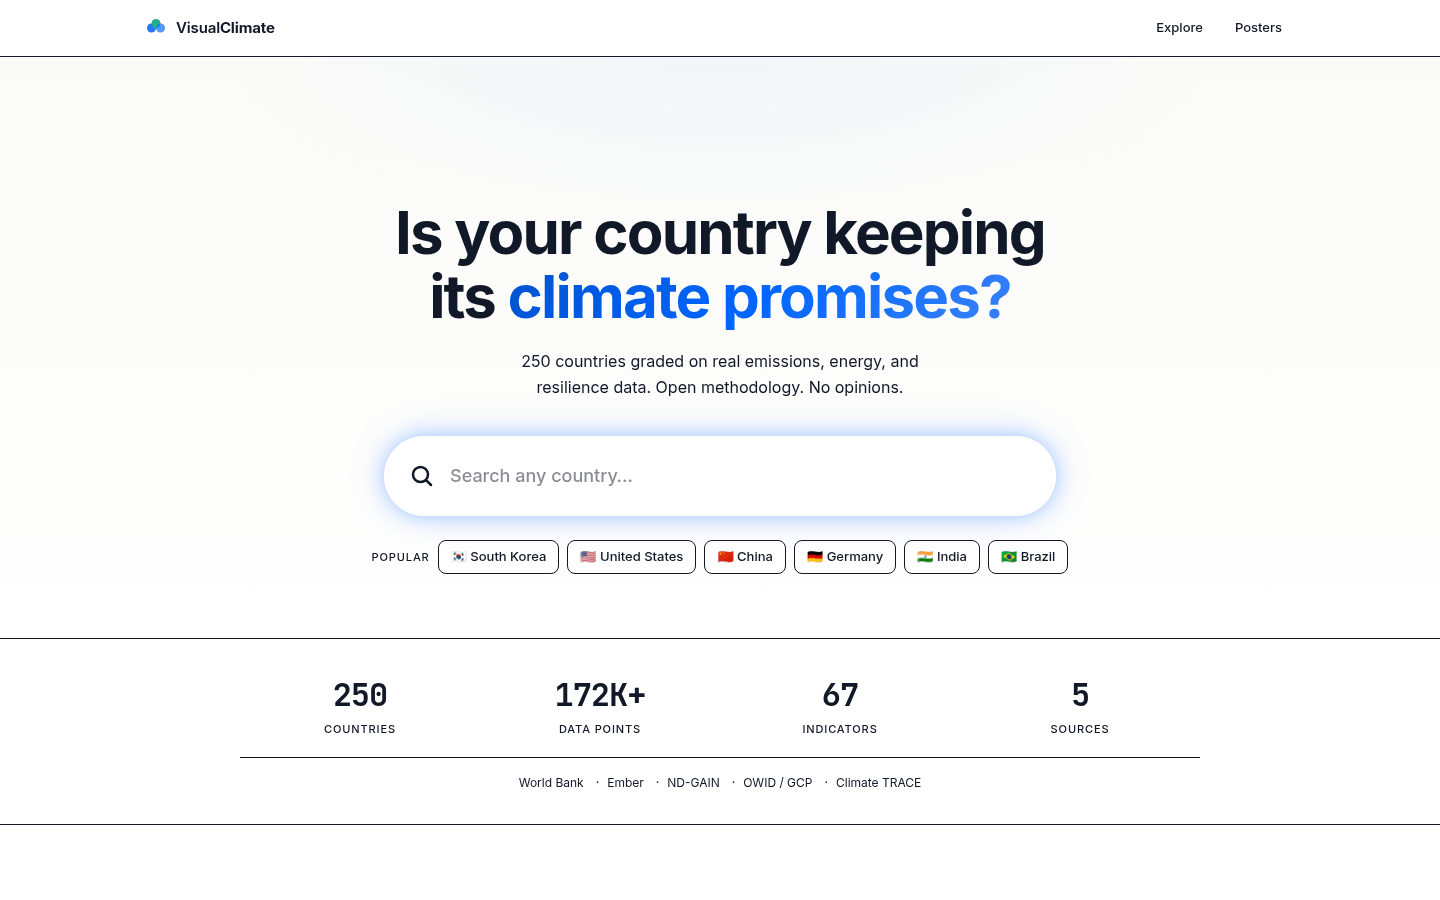
The site also sorts countries into three groups. A “Changer” is cutting carbon dioxide per person while growing its share of renewable electricity, a “Starter” is doing one of the two, and a “Talker” is doing neither. In October 2026 it listed 64 Changers, 80 Starters and 72 Talkers.
The grades come from a fixed, published formula. It uses 9 indicators in five weighted groups: emissions (30%), energy (25%), and economy, responsibility and resilience (15% each). The data comes from public sources such as the World Bank, the energy think tank Ember, Our World in Data and the climate readiness index of the Notre Dame Global Adaptation Initiative.
AI does the building, not the grading. The public code includes 14 AI agent files. Each is a set of instructions that gives an AI model one job, such as cleaning data, checking quality, testing, drawing charts, exporting PDF files or designing pages. Together they let one person build, update and check a site that would normally need a team.
Running many agents costs money. In her entry in an AI for Good report by the UN’s International Telecommunication Union (ITU), Jung reports that shortening the agents’ core instructions from 454 lines to 83 cut their token use (the units AI services bill by) by 82%, and she says that saving is what makes the project affordable for one person. We found no other source for this figure, so it is self-reported.
Impact
The site is live, free and maintained, with code updated on October 11, 2026. It says it covers 250 countries, a count that includes territories such as Guam and Gibraltar, and its report card ranks 205 of them.
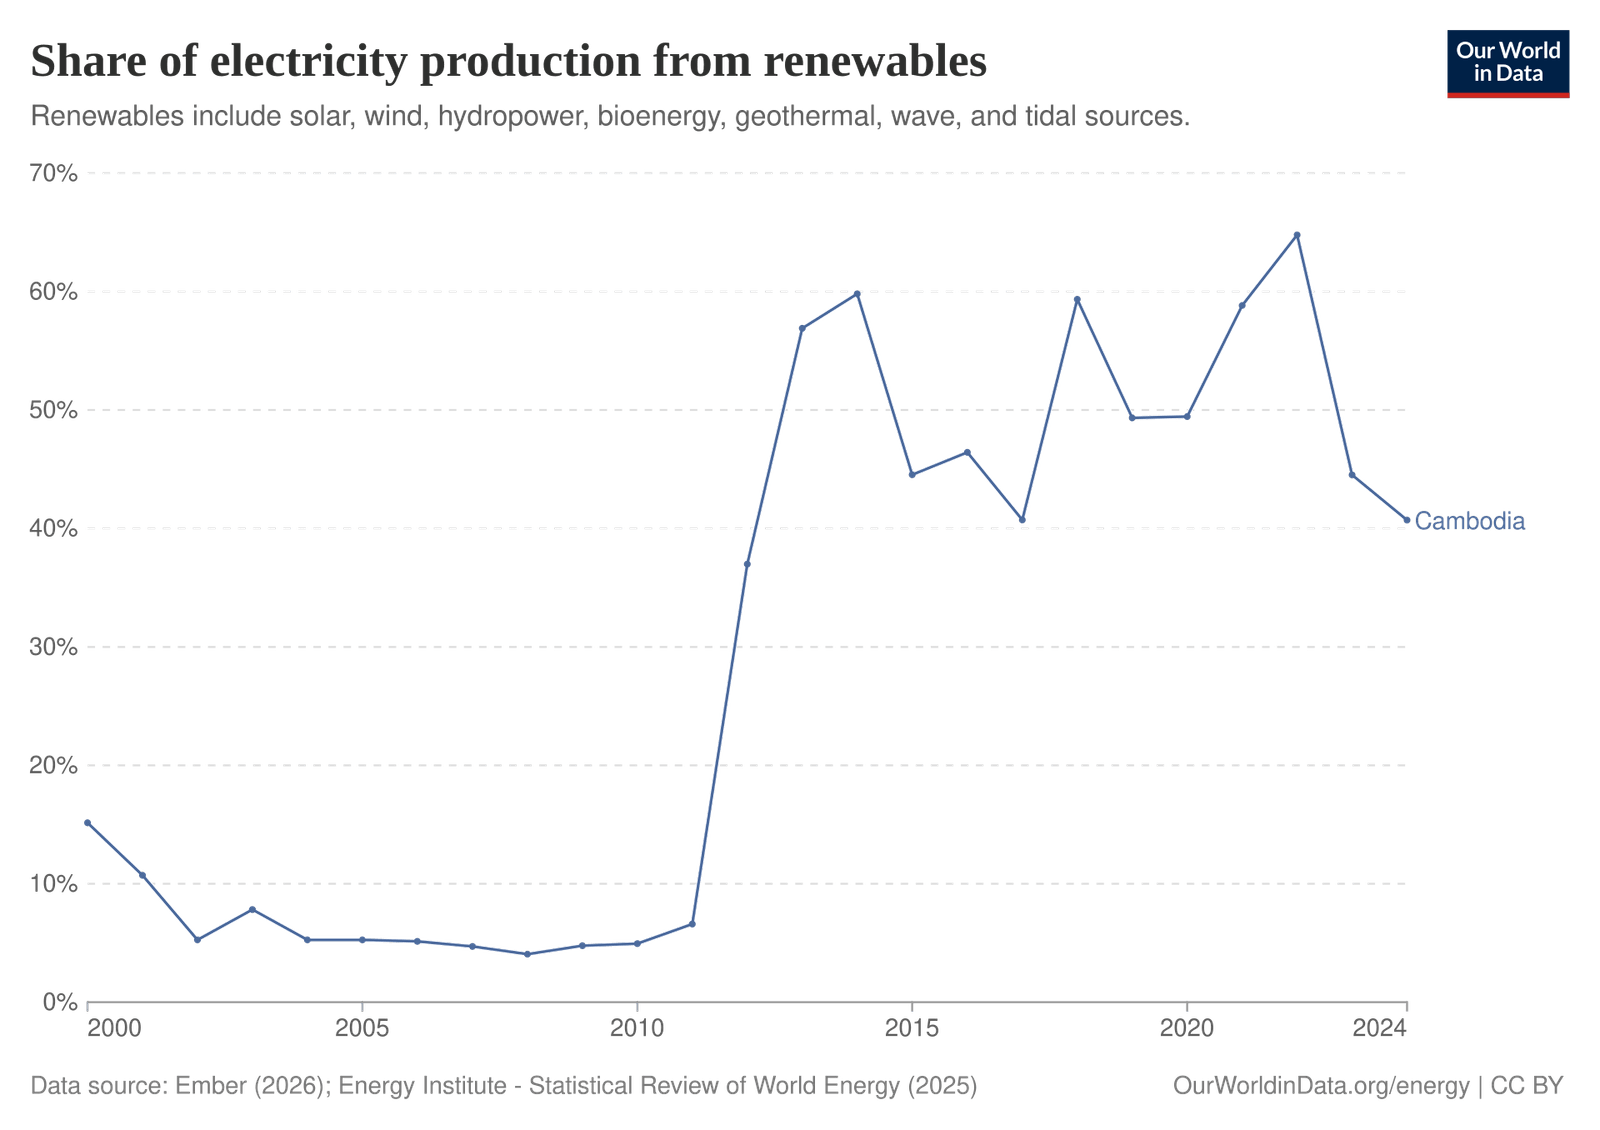
When we checked some figures against the original sources, the core numbers held up. For 2023, the site shows Cambodia’s carbon dioxide per person as 1.1 tonnes; the World Bank figure is 1.086 tonnes. It shows Cambodia’s renewable electricity share as 44.5%, close to the 42.1% Our World in Data gave for the same year when we checked on October 25, 2026.
We also found display errors on public pages, and they were still there when we checked again on October 27, 2026. The posters page shows South Korea’s numbers under Afghanistan’s name (11.4 tonnes of carbon dioxide per person, when the World Bank figure for Afghanistan is about 0.3), and Cambodia’s sector emissions chart shows the same impossible value for every sector. Mistakes like these matter in a tool built for sharing.
In her ITU entry, Jung also describes a confirmed classroom pilot in Cambodia, a distribution partnership with the Salesforce Tableau nonprofit program and more than 15,000 enrollments in her online courses. We found no other source for these, and the site is in English only.
The posters and report cards are free, and the code outlines planned paid products, such as a $49 country report. Anyone can read the code and the scoring method, though the project has no open source license.
People
For now, Visual Climate is Harim Jung. In 2025 she was a data visualization consultant at Keyrus in North America and a Tableau Public Ambassador, and she teaches two climate data courses on LinkedIn Learning, released in April and September 2025.
She has wanted to make hard data inviting for years. In 2019 she was one of three winners of an International Atomic Energy Agency data visualization challenge. In April 2025, in the main keynote of the Tableau Conference, Tableau’s chief marketing officer spoke with her about a dashboard she built with Tableau Agent, an AI assistant inside Tableau, to track global carbon dioxide emissions.
“I wanted to create something vivid that would have an aesthetic appeal and provoke curiosity so that people are encouraged to explore nuclear energy.”Harim Jung, on her 2019 International Atomic Energy Agency entry
She is also frank about the hard part: “if you have trash data, it can be a real headache, so data cleansing and processing matters a lot.”
Why it matters
Climate decisions depend on people knowing where their country stands. Visual Climate shows that AI agents can help one dedicated person build a free public tool that used to need a team, and its display errors show that the work still needs careful human checking.
What we could not confirm (3)
- Details of the Cambodia classroom pilot, such as the school or partner, dates and number of students. It appears only in Jung’s ITU entry.
- How many people visit the site or download its posters each month.
- Harim Jung’s current role in 2026. The roles described above are from 2025.
FAQs (4)
What is Visual Climate?
A free website, visualclimate.org, that grades countries' climate records from public data and turns them into report cards, charts and downloadable posters.
Does AI decide the climate grades?
No. The grades come from a published formula using 9 indicators from sources like the World Bank and Ember. The AI agents help build, update and check the site.
Is Visual Climate free?
Yes. The report cards and six poster types are free to use with no login. Paid products, such as detailed country reports, are planned.
Is Visual Climate used in schools?
The project's entry in a report by the UN's International Telecommunication Union (ITU) describes a classroom pilot in Cambodia, but we could not confirm it through other sources yet.
Sources (15)
Visual Climate, home page (accessed October 25, 2026)
Visual Climate, About (accessed October 25, 2026)
Visual Climate, Methodology (accessed October 25, 2026)
Visual Climate, Posters (accessed October 25, 2026)
Visual Climate, Cambodia profile (accessed October 25, 2026)
Visual Climate, Afghanistan profile (accessed October 25, 2026)
AI for Kind, live re-check of the Visual Climate posters page and Cambodia profile, October 27, 2026
Visual Climate code repository on GitHub (accessed October 25, 2026)
Kontinentalist, Meet the community: Harim Jung, data viz expert and nuclear engineer, 2021
IAEA, IAEA selects best visualizations of Atoms4Climate, 2019
Tableau, Top 10 announcements from the TC25 keynote, 2025
Keyrus, Keyrus to present at Tableau Conference 2025, 2025
ITU, AI for Good Innovate for Impact Interim Report 2026, Visual Climate, pp. 222–231
Fact-checked against sources on October 27, 2026. Spot an error? Tell us.
This story supports